- Visibility 19 Views
- Downloads 6 Downloads
- DOI 10.18231/j.ijnmhs.2020.025
-
CrossMark

The effect of nutrition intervention based on a Knowledge-Attitude-Practice questionnaire in the weight management of overweight and obese persons
Introduction
Overweight and obesity are increasing worldwide and recently has been proposed to be considered as a disease condition by the World Health Organization. The Global BMI Mortality Collaboration(2016)[1] conducted a meta analysis of prospective studies of BMI with all cause mortality in Asia, Australia and New Zealand, Europe and North America and concluded that the associations were consistent in all four continents. South Asians are prone to deposit higher percentage of body fat in lower BMI and hence towards the development of health issues associated with overweight. It was emphasized by researchers in the field of obesity and in various guidelines published for the management of obesity that adherence to a healthy lifestyle and consumption of a balanced diet are essential for weight management. A 2016 publication by Aveyard, P [2] et al demonstrated that physician delivered opportunistic intervention was an effective way to reduce population mean weight. For adapting a suitable diet pattern and lifestyle, every person should have a sound knowledge on scientific methods of managing weight. Knowledge-Attitude-Practice (KAP) based interventions are quite useful to impart knowledge and improve nutrition practices of population. KAP studies are indispensable for evaluating nutrition-education and communication interventions, i.e. activities that explicitly address (and aim to improve) people’s nutrition-related knowledge, attitudes and practices. (FAO 2014).[3] A KAP based nutrition intervention done in adolescents by Shettigar, PG and Jayalekshmi, HB [4] revealed that knowledge regarding healthy eating habits and physical activity were low among adolescents and nutrition intervention helped in improving the same. Majumdar, S and Das, D [5] analysed the nutrition related knowledge, attitude and practice of sub junior and junior Kabaddi players of India and the knowledge level was found to be low among players. Lakhan, R [6] researched on KAP tool for intellectual disability and concluded that information gained through the survey on KAPID found to be useful in designing the behavioral, awareness, educational,health promotional, and interventional program for the population with intellectual disabilities in rural poor settings. Doctoral research based on KAP tool by Gracy, V [7] in 2014 proved that a small change in the level of knowledge in caregiver of children with Cerebral Palsy would have an effect on the attitude to some extent and, on the practices to a great extent.
The present study was undertaken to assess the role of a KAP based intervention in lifestyle modifications of obese and overweight respondents.
Aim
To study the effect of KAP tool on nutrition intervention in the lifestyle modification of obese respondents
Objectives
To develop a validated tool for analyzing the knowledge, attitude and practice of the respondents in relation to obesity.
To construct nutrition education materials based on the data derived.
To impart education with these tools in a structured way and to analyze the significance of change achieved.
Materials and Methods
The criteria for inclusion in this study were age (20-50years), BMI (23 Kg/m2 - 50 Kg/m2), regularity in follow up and compliance to the modifications suggested. The respondents who will benefit from the intervention were identified through their demographic parameters (viz age, gender, occupation, education and monthly income), physical activity level, obesity history, anthropometric and biochemical parameters and dietary pattern.
Knowledge-Attitude- Practice questionnaire was designed through a pilot study. Nutrition education material was prepared in English and in local language as a tool to aid in the individual counselling and the respondents were educated using this before the study and repeated every month till they completed the study.
A detailed information booklet which informed participants principles of management of obesity, 7 day cyclic menu plan, and the format of food diary was provided to each participant. Food exchange list recommended by NIN (2014) [8] for 1200 kcals diabetic diet was followed for menu planning and the American Heart Association (AHA 2014) [9] format was followed for food diary. The menu plan included common functional foods with low to moderate glycemic index.
Nutrition intervention
On review, a questionnaire was administered to test the knowledge, attitude and practice, followed by nutrition education through power point presentations and menu and food displays. Respondents were given education as individual session and small group sessions. The retention of knowledge was tested at the end of one month and late retention at the end of three months. Change in anthropometric data, biochemical data and dietary pattern was assessed to analyse the impact. Quality of diet was interpreted through Alternate Healthy Eating Index (AHEI). [10]
Results and Discussions
Though the sample size targeted was 50, Nearly 100 respondents turned up for first review after the survey. 66 respondents turned up for one month review and only 23 respondents reviewed till three month. Data of the 66 respondents were considered for analysis of the change in various study parameters and retention study was completed with the help of 23 respondents.
Plot 1 details the distribution of important demographic variables in the study viz, age, monthly family income and family obesity score. Family obesity score was calculated from the incidence of overweight and obesity among first and second degree relatives of the respondents.
Plot 1: Demographic distribution of the respondents
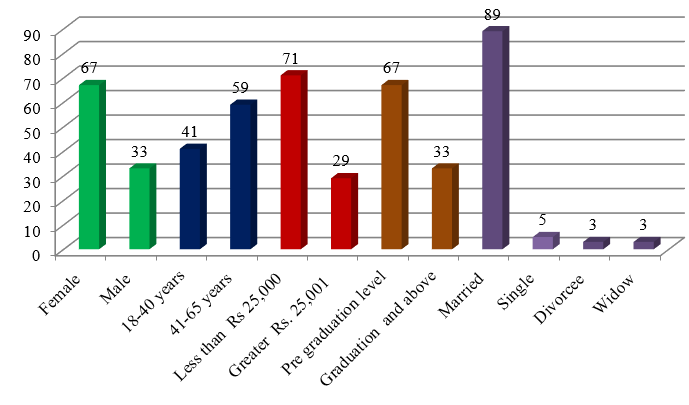
It was observed that larger segment of respondents were elderly married females educated up to pre graduation level. Mean age of the respondents was 45.29 ±12.60 years and monthly family income was 27621.21±25623.77 rupees. The education level was below graduation in 67% of the respondents and 89% of them were married. Family obesity score values obtained ranged from 7-21 with a mean score of 16.11±3.84 which indicated that the incidence of overweight and obesity was high among the relatives of the respondents.
The associations between different demographic continuous variables were studied using Fisher’s exact test. The association of monthly income with gender distribution, educational status, type of occupation, and mode of transportation were studied and the results indicated that respondents did not differ much among themselves in these parameters. The type of occupation and income category was analysed for association with reason for weight gain and the p values obtained were 0.8026 and 0.1240 respectively indicating that the reason for weight gain were not the income or occupation.
History of the weight loss trials attempted by the subjects were collected and analysed. It was observed that 74% of the respondents had tried to lose weight through various methods and of them, 67% had achieved weight loss. But only 35% among those who achieved could sustain the loss and others regained when they discontinued the trial.
The intervention was carried out on the basis of KAP questionnaire and an analysis of change based on the change in scores and the influence of change in each domain on the other domains were carried out. The anthropometric, biochemical and dietary data were also analysed through comparison of data before and after the intervention. Alternate healthy eating index was used to interpret the quality of the dietary intake.
The knowledge, attitude and practice scores were compared with the various variables. Regression analysis of each domain was done against age, family obesity score, education status, type of occupation and family income.
|
Parameters |
Knowledge score |
Attitude score |
Practice score |
|||
|
Estimate |
P value |
Estimate |
P value |
Estimate |
P value |
|
|
Intercept |
8.717427554 |
<.0001 |
65.66730813 |
<.0001 |
0.078812628 |
0.0693 |
|
Age |
-0.005161627 |
0.8313 |
0.05632692 |
0.5028 |
0.036240674 |
0.7660 |
|
Family Obesity Score |
0.112833394 |
0.1071 |
-0.12377047 |
0.6062 |
-2.016924096 |
0.0595 |
|
Education Status: pre graduation level |
0.656100515 |
0.2820 |
-0.39410695 |
0.8513 |
0.000000000 |
. |
|
Education Status: graduation and above |
0.000000000 |
. |
0.00000000 |
. |
4.952266702 |
0.0648 |
|
Type of occupation: moderate |
0.496923115 |
0.4273 |
-0.99006105 |
0.6473 |
0.000000000 |
. |
|
Type of occupation: sedentary |
0.000000000 |
. |
0.00000000 |
. |
1.170568896 |
0.2513 |
|
Income category: less than 25000 Rs/month |
0.177546535 |
0.7597 |
2.07202203 |
0.3046 |
0.000000000 |
. |
|
Income category: more than 25001 Rs/month |
0.000000000 |
. |
0.00000000 |
. |
0.078812628 |
0.0693 |
Regression analysis was done with KAP scores against demographic variables to see whether they have influenced the scores. None of the tested parameters exhibited influence on the initial knowledge level and attitude scores. Though not statistically significant, family obesity score had the strongest association with the initial knowledge score. Higher family obesity score was associated with lower knowledge score. Family obesity score and lower education had a negative influence on attitude. There is a clear impact of education in practice and family obesity score was negatively influencing practice. In a 2008 study by P Geetha [11] using KAP tool among beneficiaries of National Nutritional Anaemia Control Program concluded that family type, educational status, social participation, family income and family educational status appeared to have a significant association with knowledge. A Chinese study by Zijian Li et al (2017) [12] about the factors influencing knowledge, attitude and practice regarding medical nutrition therapy in diabetic individuals identified gender, occupation, education level, residence as important influencing factors.
The average scores obtained by the respondents using the KAP tool before the study, immediately after intervention, 1 month post intervention and at the end of 3 months (final intervention) were calculated.
It was observed that the initial scores in all the three domains were low, highest scores obtained immediately after the intervention and lower than this value at the end of one month and 3 months. The significance of change was analysed through t test and the results obtained are presented in [Table 2].
|
Intervention stages |
Knowledge score |
Attitude score |
Practice score |
|||
|
Mean ± SD |
P value |
Mean ± SD |
P value |
Mean ± SD |
P value |
|
|
Pre intervention N=66 |
11±2.02 |
|
67.02±6.81 |
|
10.79±3.69 |
|
|
Immediate post intervention N=66 |
15.3±2.57 |
<.0001 |
80.3 ±12.47 |
<.0001 |
15.62±3.42 |
<.0001 |
|
Post intervention N=66 |
13.8±2.3 |
<.0001 |
72.49±7.40 |
<.0001 |
13.54±2.66 |
<.0001 |
|
Final intervention N=23 |
12.96±1.69 |
<.0001 |
73.13±10.56 |
<.0001 |
12.48±2.79 |
<.0001 |
The knowledge, attitude scores, and practice scores demonstrated significant changes between pre intervention score and at all the post intervention scores.
A 2017 study from Kerala by Krishnendu, M and Gokhale, JD [13] analysed the KAP level of lactating mothers and found that the breast feeding was not practiced to the fullest and recommended strengthening of prenatal and postnatal interventions. Liu, H et al (2018) [14] analysed the nutrition related knowledge- attitude- practice of kindergarten teachers in China and found they are deficient in nutrition related knowledge but had good attitude towards improving their knowledge. A 2019 study by Pokharel, P and Shettigar, PG [15] based on KAP and nutritional status analysis in HIV patients concluded that counselling improved knowledge level significantly. A review by Das, S and Das, SK (2013) [16] about KAP studies related with stroke concluded that, continued and intensified educational efforts to promote knowledge of stroke, particularly among high-risk groups, are needed by policymakers, as well as local and national organizations. A 2015 research by Kigaru, et al [17] among urban primary school children in Nairobi revealed that children had moderate nutrition knowledge and poor dietary practices, associated with negative dietary attitude. Srivastava, S[18] et al in 2017 reported the result of the fourth consecutive study of a KAP based intervention in the diabetic population attending a tertiary care hospital in New Delhi and has suggested continuous education as an effective tool to empower diabetic subjects.
Regression analysis was done to test whether the change in knowledge level has influenced the change in the attitude and practice scores of the respondents.
|
Intervention stages |
Domain |
Parameter |
Estimate |
p value |
|
Immediate post intervention |
Attitude |
Intercept Influence of change |
0.95 3.31 |
0.633 <.0001 |
|
Practice |
Intercept Influence of change |
0.039 1.129 |
0.951 <.0001 |
|
|
Post intervention |
Attitude |
Intercept Influence of change |
-5.513 0.047 |
<.0001 0.8930 |
|
Practice |
Intercept Influence of change |
-2.819 0.008 |
<.0001 0.9630 |
|
|
Final intervention |
Attitude |
Intercept Influence of change |
-6.443 -1.0589 |
0.0238 0.2484 |
|
Practice |
Intercept Influence of change |
-1.755 0.1803 |
0.1127 0.6146 |
The results of the regression analysis showed that there was a strong influence of change in knowledge level in the change in attitude and practice scores in the immediate post intervention period. This influence was not reflected in the post intervention and final intervention phases. In the post intervention and final intervention stages, the increment in attitude and practice scores were independent of change in knowledge level and could be considered as an evidence for actual change in their attitude and practice related to obesity.
The change in various anthropometric and biochemical parameters were analysed through t test to check whether the change is significant. Following table presents the result of this investigation.
|
Variables |
Statistic |
Value |
p value |
||
|
Before |
After |
Change |
|||
|
Weight (N=66) |
Mean±SD |
76.76±12.14 |
75.43±11.92 |
1.33±1.54 |
<0.0001 |
|
Range |
54.6-103.9 |
54-103.9 |
-1.5-5.8 |
||
|
BMI (N=66) |
Mean±SD |
30.29±4.29 |
29.75±4.24 |
0.54±0.65 |
<.0001 |
|
Range |
22.9-42.7 |
22.4-41.7 |
-0.6-1.9 |
||
|
Body fat percentage (N=66) |
Mean±SD |
36.25±5.76 |
35.85±6.04 |
0.4±1.72 |
0.0665 |
|
Range |
26.2-46.5 |
24.7-46.3 |
-5.2-9.7 |
||
|
Visceral fat% (N=66) |
Mean±SD |
15.12±5.8 |
14.56±5.58 |
0.56±1.71 |
0.0099 |
|
Range |
5-30 |
4-30 |
-4-6 |
||
|
Waist Circumference (N=66) |
Mean±SD |
98.52±9.58 |
97.7±9.13 |
0.82±3.17 |
0.04 |
|
Range |
79-119 |
78-120 |
-8-8 |
||
|
Hip circumference (N=66) |
Mean±SD |
109.77±10.07 |
108.98±9.86 |
0.79±2.96 |
0.0342 |
|
Range |
92-138 |
91-138 |
-7-9 |
||
|
Fasting Blood Sugar (N=66) |
Mean±SD |
126.62±50.17 (n=55) |
113.04±34.34 (n=50) |
11.1±42.04 |
0.0738 |
|
Range |
73.9-298.6 |
73-266.8 |
-172.5-142.6 |
||
|
Random Blood Sugar (N=66) |
Mean±SD |
200.53±83.46 (n=26) |
177.62±73.42 (n=32) |
58.74±3.74 |
0.7628 |
|
Range |
92-361 |
78.8-351 |
-83.1-159 |
||
|
Serum cholesterol (N=66) |
Mean±SD |
187.27±33.39 |
184.69±31.69 |
2.58±30.72 |
0.4979 |
|
Range |
137-297 |
125-287.9 |
-127.6-75.4 |
||
|
Hemoglobin (N=66) |
Mean±SD |
12.07±1.06 |
12.03±1 |
0.04±0.6 |
0.5535 |
|
Range |
8-14.9 |
7-14.3 |
-1.9-1.7 |
||
|
Uric acid (N=66) |
Mean±SD |
4.89±1.38 |
4.69±1.07 |
0.2±0.84 |
0.0604 |
|
Range |
2.4-10.9 |
2.4-8.4 |
-2.1-4.4 |
The change in the anthropometric parameters like weight, BMI, Visceral fat percentage, waist circumference and hip circumference were found to be significant as the p values were less than 0.05. Though the change in body weight and visceral fat were significant, the change in total body fat percentage was not statistically significant. Even though the biochemical parameters exhibited a reduction after the intervention, these changes were not statistically significant.
Erin L. LeBlanc, [19] et al in 2018 found that behavior-based weight-loss interventions with or without weight loss medications resulted in more weight loss than usual care conditions. A south Indian study conducted by Gajalakshmi, V [20] et al(2018) revealed that BMI was little associated with vascular mortality, even though increased BMI is associated with increased systolic blood pressure.
The requirement of energy and macronutrients were calculated based on adjusted ideal weight[21] to derive reducing calories and corresponding other nutrients. The dietary intake of respondents was analyzed using paired t test against the estimated requirement to see whether their intake was exceeding what is required.
|
Variables |
Statistic |
Value |
p value |
||
|
Requirement |
Intake |
Difference |
|||
|
Energy (N=66) |
Mean±SD |
1276.52±209.02 |
1573.29±382.66 |
-296.77±373.94 |
<.0001 |
|
Range |
960-2070 |
810-2699 |
-1219-454 |
||
|
Protein (N=66) |
Mean±SD |
50.80±7.65 |
56.72±14.81 |
-5.89±15.56 |
0.0029 |
|
Range |
38-69 |
19-89 |
-37.71-27.99 |
||
|
Fat (N=66) |
Mean±SD |
21.24±3.59 |
50.93±15.94 |
-29.66±15.52 |
<.0001 |
|
Range |
16-35 |
20-80 |
-57.9-1.3 |
||
|
Carbohydrates (N=66) |
Mean±SD |
220.42±36.89 |
246.35±64.04 |
-25.94±64.65 |
0.0018 |
|
Range |
166-371 |
49-454 |
-199.17-192 |
||
|
Fiber (N=66) |
Mean±SD |
35±0 |
27.56±9.41 |
7.41±9.41 |
<.0001 |
|
Range |
35 |
12-54 |
-18.63-23 |
The estimates were analyzed with 5% significance level with p value < .05 being significant. All the p values were <0.05 and the mean values of the difference suggested that the intake of Energy, protein, fat and carbohydrates were more than their requirement while intake of fibre was not meeting the requirement.
The quality of diet was analysed using AHEI scores and the following table describes the result of paired t test among AHEI and KAP scores.
|
Parameters |
AHEI category |
Statistic |
Value |
p value |
||
|
Pre intervention |
Post intervention |
Difference |
||||
|
Knowledge (N=66) |
AHEI ≥51 (n=42) |
Mean±SD |
11.14±1.87 |
13.88±2.11 |
-2.73±2.15 |
<.0001 |
|
Range |
8-16 |
9-18 |
-7-1 |
|||
|
AHEI˂51 (n=24) |
Mean±SD |
10.75±2.29 |
13.58±2.59 |
-2.83±2.09 |
<.0001 |
|
|
Range |
5-15 |
7-17 |
-6-3 |
|||
|
Attitude (N=66) |
AHEI ≥51 (n=42) |
Mean±SD |
66.05±6.74 |
72.05±7.37 |
-6.29±5.92 |
<.0001 |
|
Range |
51-78 |
52-85 |
-21-9 |
|||
|
AHEI˂51 (n=24) |
Mean±SD |
68.71±6.73 |
73.25±7.55 |
-4.54±5.97 |
0.0011 |
|
|
Range |
54-79 |
52-84 |
-12-11 |
|||
|
Practice (N=66) |
AHEI ≥51 (n=42) |
Mean±SD |
11.5±3.58 |
13.88±2.37 |
-2.51±2.32 |
<.0001 |
|
Range |
5-19 |
9-19 |
-9-3 |
|||
|
AHEI˂51 (n=24) |
Mean±SD |
9.54±3.62 |
12.96±3.06 |
-3.42±3.62 |
0.0001 |
|
|
Range |
2-18 |
5-18 |
-11-4 |
On analyzing this table, it was seen that respondents with good quality diet had scored positively in knowledge, attitude and practice and the relation was statistically significant. Whereas, respondents with poor quality diet habit as indicated by AHEI below 50 did not have a statistically significant relation with the scores obtained in all the three domains.
Out of the 66 respondents who turned up for the first review of the KAP study, only 23 completed till the last visit. The diet recall was recorded during the last visit and the intake of macronutrients and different components of fiber were recorded. The values were compared with the pre study values and paired t test was conducted. The results are presented below.
|
Variables |
Statistic |
Value |
p value |
||
|
Before |
After |
Difference |
|||
|
Energy (N=23) |
Mean±SD |
1477.87±320.66 |
1417±323.75 |
60.87±358.45 |
0.4241 |
|
Range |
1043-2267 |
797-1976 |
-729-926 |
||
|
Protein (N=23) |
Mean±SD |
52.26±12.4 |
52.74±11.83 |
-0.48±12.89 |
0.8605 |
|
Range |
28-79 |
32-90 |
-36-20 |
||
|
Fat (N=23) |
Mean±SD |
48.48±16.34 |
42.65±14.39 |
5.83±13.34 |
0.0480 |
|
Range |
20-80 |
20-70 |
-23-31 |
||
|
Carbohydrates (N=23) |
Mean±SD |
243.52±54.08 |
239.09±56.51 |
4.44±65.53 |
0.7486 |
|
Range |
162-389 |
104-322 |
-132-127 |
||
|
Total Fiber (N=23) |
Mean±SD |
23.52±5.67 |
25.52±5.95 |
-2±5.71 |
0.1073 |
|
Range |
12-37 |
12-35 |
-17-8 |
||
|
Soluble dietary fiber (N=23) |
Mean±SD |
5.04±1.19 |
5.52±1.41 |
-0.48±1.24 |
0.0775 |
|
Range |
3-8 |
3-8 |
-4-2 |
||
|
Insoluble dietary fiber (N=23) |
Mean±SD |
18.26±4.60 |
19.52±4.48 |
-1.26±4.62 |
0.2045 |
|
Range |
9-29 |
9-28 |
-13-8 |
Paired t test was conducted to check whether the change in intake of nutrients before and after the study were significant. The estimates were analysed with 5% significance level with a p value <0.05. The mean values of change from before to after suggest that there was decrease in intake of fat, carbohydrates and energy, and increase in fibre and protein. But taking p value into consideration, only fat had a significant decrease.
Summary
Larger segment of respondents were elderly married females educated up to pre graduation level. Mean age of the respondents was 45.29 ±12.60 years and monthly family income was 27621.21±25623.77 rupees. Family obesity score values obtained ranged from 7-21 with a mean score of 16.11±3.84.
The association of monthly income with gender distribution, educational status, type of occupation, and mode of transportation were studied using Fisher’s exact test and the results indicated that respondents did not differ much among themselves in these parameters. The type of occupation and income category was analysed for association with reason for weight gain and the p values obtained were 0.8026 and 0.1240 respectively indicating that the reason for weight gain were not the income or occupation.
History of the weight loss trials attempted by the subjects were collected and analysed. The most common method tried by the respondents for weight loss was diet control (47%) followed by exercise trials (26%) with very few reporting other methods. 74% of the respondents had tried to lose weight through various methods and of them, 67% had achieved weight loss, but only 35% among those who achieved could sustain the loss.
Regression analysis was done with KAP scores against demographic variables and none of the tested parameters exhibited influence on the initial knowledge level and attitude scores. Though not statistically significant, family obesity score had the strongest association with the initial knowledge score. Family obesity score and lower education had a negative influence on attitude. There is a clear impact of education in practice and family obesity score was negatively influencing practice.
Distribution of KAP scores obtained at various stages of intervention revealed that initial scores in all the three domains were low, highest scores obtained immediately after the intervention and lower than this value at the end of one month and 3 months.The significance of change was analysed through t test and found that the knowledge scores, attitude scores, and practice scores demonstrated significant changes between pre intervention scores and at all the post intervention scores.
Regression analysis proved that there was a strong influence of change in knowledge level in the change in attitude and practice scores in the immediate post intervention period. This influence was not reflected in the post intervention and final intervention phases.
The change in the anthropometric parameters like weight, BMI, Visceral fat percentage, waist circumference and hip circumference were found to be significant as the p values were less than 0.05. Though the biochemical parameters exhibited a reduction after the intervention, these were not statistically significant.
The difference between habitual intake of macronutrients and their requirement were analysed and the mean values of the difference suggested that the intake of Energy, protein, fat and carbohydrates were more than their requirement while intake of fibre was not meeting the requirement.
The quality of diet in terms of AHEI was compared against the scores obtained through KAP tool and it was observed that respondents with good quality diet had scored positively in knowledge, attitude and practice and the relation was statistically significant. The change in intake of macronutrients before and after the intervention was analysed through paired t test and the mean values of change suggest that there was decrease in intake of fat, carbohydrates and energy, and increase in fiber and protein.
Conclusion
It was concluded from this experiment that dietary quality had a strong influence on the nutritional status of overweight and obese persons and a nutrition intervention based on KAP questionnaire was effective in managing the weight and lifestyle pattern of the respondents.
Conflicts of Interest
All contributing authors declare no conflicts of interest.
Source of Funding
None.
References
- . The Global BMI Mortality Collaboration. “Body-mass index and all cause mortality: individual-participant – data meta- analysis of 239 prospective studies in four continents. Lancet 2016. [Google Scholar]
- P Aveyard, A Lewis, S Tearne, K Hood, A Christian-Brown, P Adab. Screening and brief intervention for obesity in primary care: a parallel, two-arm, randomised trial. Lancet 2016. [Google Scholar] [Crossref]
- Y F Macias, P Glasauer. Guidelines for assessing nutrition-related Knowledge, Attitudes and Practices, KAP Mannual.”Food and Agriculture Organisation of the United Nations. 2014. [Google Scholar]
- Jayalekshmi-1 Shettigar, H B. Effect of nutrition education on knowledge, attitude and practice of eating habits and physical activity among adolescents. Proceedings of the 50th Annual National Conference of Indian Dietetic Association 2017. [Google Scholar]
- S Majumder, D Das. Knowledge,attitude and practice related to sports nutrition among sub junior and junior Kabaddi players in India.” Proceedings of the 50th Annual National Conference of Indian Dietetic Association. 2017. [Google Scholar]
- R Lakhan. Knowledge, Attitude and Practice Survey Tool for Intellectual Disability (KAP-ID). Nepal J Med Sci 2014. [Google Scholar] [Crossref]
- V C Gracy. A study on the knowledge attitude and practice of Caregivers of children with cerebral palsy”. Thesis submitted for PhD in Nursing, Vinayaka Missions University, Salem, Tamil Nadu. 2014. [Google Scholar]
- T C Raghuram, S Pasricha, R D Sharma. Diet and Diabetes’’. National Institute of Nutrition, Indian Council of Medical Research. 2014. [Google Scholar]
- . Food diary format by American heart association and American stroke association. 2014. [Google Scholar]
- SE Chiuve, TT Fung, EB Rimm, FB Hu, M L McCullough, M Wang. Alternative Dietary Indices Both Strongly Predict Risk of Chronic Disease. J Nutr 2012. [Google Scholar] [Crossref]
- P Geetha. Evaluation of National Nutritional Anaemia Control Program through assessment of Knowledge, Attitude and Practice among the program participants. PhD Home Science Thesis. Kerala University. 2008. [Google Scholar]
- Z Li, H Jin, W Chen, Z Sun, L Jing, X Zhao. Influencing Factors of Knowledge, Attitude, and Practice regarding Medical Nutrition Therapy in Patients with Diabetes: A National Cross-Sectional Study in Urban China. J Diabetes Res 2017. [Google Scholar] [Crossref]
- M Krishnendu, G J Devaki. Knowledge, Attitude and Practice TowardsBreasfeeding among Lactating Mothers in Rural Areas of Thrissur District of Kerala, India: A Cross-Sectional Study”. . Biomed Pharmacol J 2017. [Google Scholar] [Crossref]
- H Liu, X Xu, D Liu, Y Rao, C Reis, M Sharma. Nutrition-Related Knowledge, Attitudes, and Practices (KAP) among Kindergarten Teachers in Chongqing, China: A Cross-Sectional Survey”. Int J Environ Res Public Health 2018. [Google Scholar]
- P Pokharel, P G Shettigar. Impact of counseling in knowledge, attitude and practice and association of nutritional status with CD4 count and opportunistic infections of HIV patients of Udupi, India. Clin Nutr ESPEN 2019. [Google Scholar] [Crossref]
- S Das, S K Das. Knowledge, attitude and practice of stroke in India versus other developed and developing countries. Ann Indian Acad Neurol 2013. [Google Scholar] [Crossref]
- D M Kigaru, C Loech, T Moleah, C W Macharia-Mutie, Z W Ndugal. Nutrition knowledge, attitude and practices among urban primary school children in Nairobi City, Kenya: a KAP study. BMC Nutr 2015. [Google Scholar] [Crossref]
- S Srivastava, S Khurana, R Bhandari, S Kushwaha. Assessing the Knowledge, Attitudes and Practices of type 2 Diabetic Patients of J.P.N. Apex Trauma Centre, AIIMS, New Delhi, India, in The Fourth Consecutive study’’. Proceedings of the 50th Annual National Conference of Indian Dietetic Association, Kolkata. 2017. [Google Scholar]
- ES LeBlanc, C D Patnode, E M Webber, N Redmond, M Rushkin, E A O'Connor. Behavioral and Pharmacotherapy Weight Loss Interventions to Prevent Obesity-Related Morbidity and Mortality in Adults: Updated Evidence Report and Systematic Review for the US Preventive Services Task Force. JAMA 2018. [Google Scholar] [Crossref]
- V Gajalakshmi, B Lacey, V Kanimozhi, P Sherliker, R Peto, S Lewington. Body-mass index, blood pressure, and cause-specific mortality in India: a prospective cohort study of 500 810 adults. Lancet Global Health 2018. [Google Scholar] [Crossref]
- . Clinical nutrition manual by Indian Dietetic Association. 2011. [Google Scholar]